
2024-2025 Broadway Season: Demographic Survey Round-Up
The Broadway League published its 2024-2025 demographic report, filled with fascinating insights into today’s Broadway audiences — and a glimpse of where they might be heading next.
Broadway logged 14.66 million attendees this past season — just shy of the previous record-setting 2018-2019 season. While that headline is celebratory, it can be misleading. Growth isn’t evenly distributed: who is buying, when they buy, and why they chose specific shows have all shifted meaningful since the pre-COVID era.
Analyzing this data helps producers track audience trends and, ultimately, assess the impact of their own strategies.
Below, I highlight key points I gathered from the report, some of my own ‘hot takes’, and then why methodology gaps could matter as we digest this information.
Of course, all data is courtesy of the Broadway League, and all statistics below are from their annual report unless otherwise noted.
1: Geography Rebalanced: Suburban Dips and Tourism Surges
Highlights
NYC suburbs fell to 12.6% of admissions — the lowest share in 30 years. Pre-pandemic seasons typically sat several points higher (~17%-18%).
International audiences rebounded to 20.3% overall — with 22% at musicals and just 11% at plays.
Domestic U.S. tourism on Broadway rose to 6.2mm, up from 5.6mm last season (helped by an extra week in the 2024-2025 season).
Audience mix varies materially by run length. Shows in their first <4 months are much more local, and only after 1-3 years do international shares begin to dominate.
Seasonality matters: winter leans local; summer/spring tilt to U.S. visitors; fall is peak for international tourists.
Performance time matters: Suburban audiences prefer weekend matinees; international visitors favor evenings.
Takeaways
Appealing to a local audience first needs to remain paramount. New plays especially rely on early NYC demand — appealing to home base first can help in a show’s success. (We’ve seen this recently with several shows that become local favorites: Oh, Mary! or Titanique come to mind).
Program musical marketing around tourist gravity. Continue to anchor these marketing calendars (specifically multilingual assets and concierge/hotel partnerships) around fall/summer and evening performances.
Think about engineering weekend matinees for the shrinking suburbs. Things like: earlier curtains, commuter-rail bundles, parking partnerships, and family pricing will be necessary to keep this audience coming back.

Chart and data courtesy of The Broadway League.
2: The Decision Engine is Instagram
Highlights
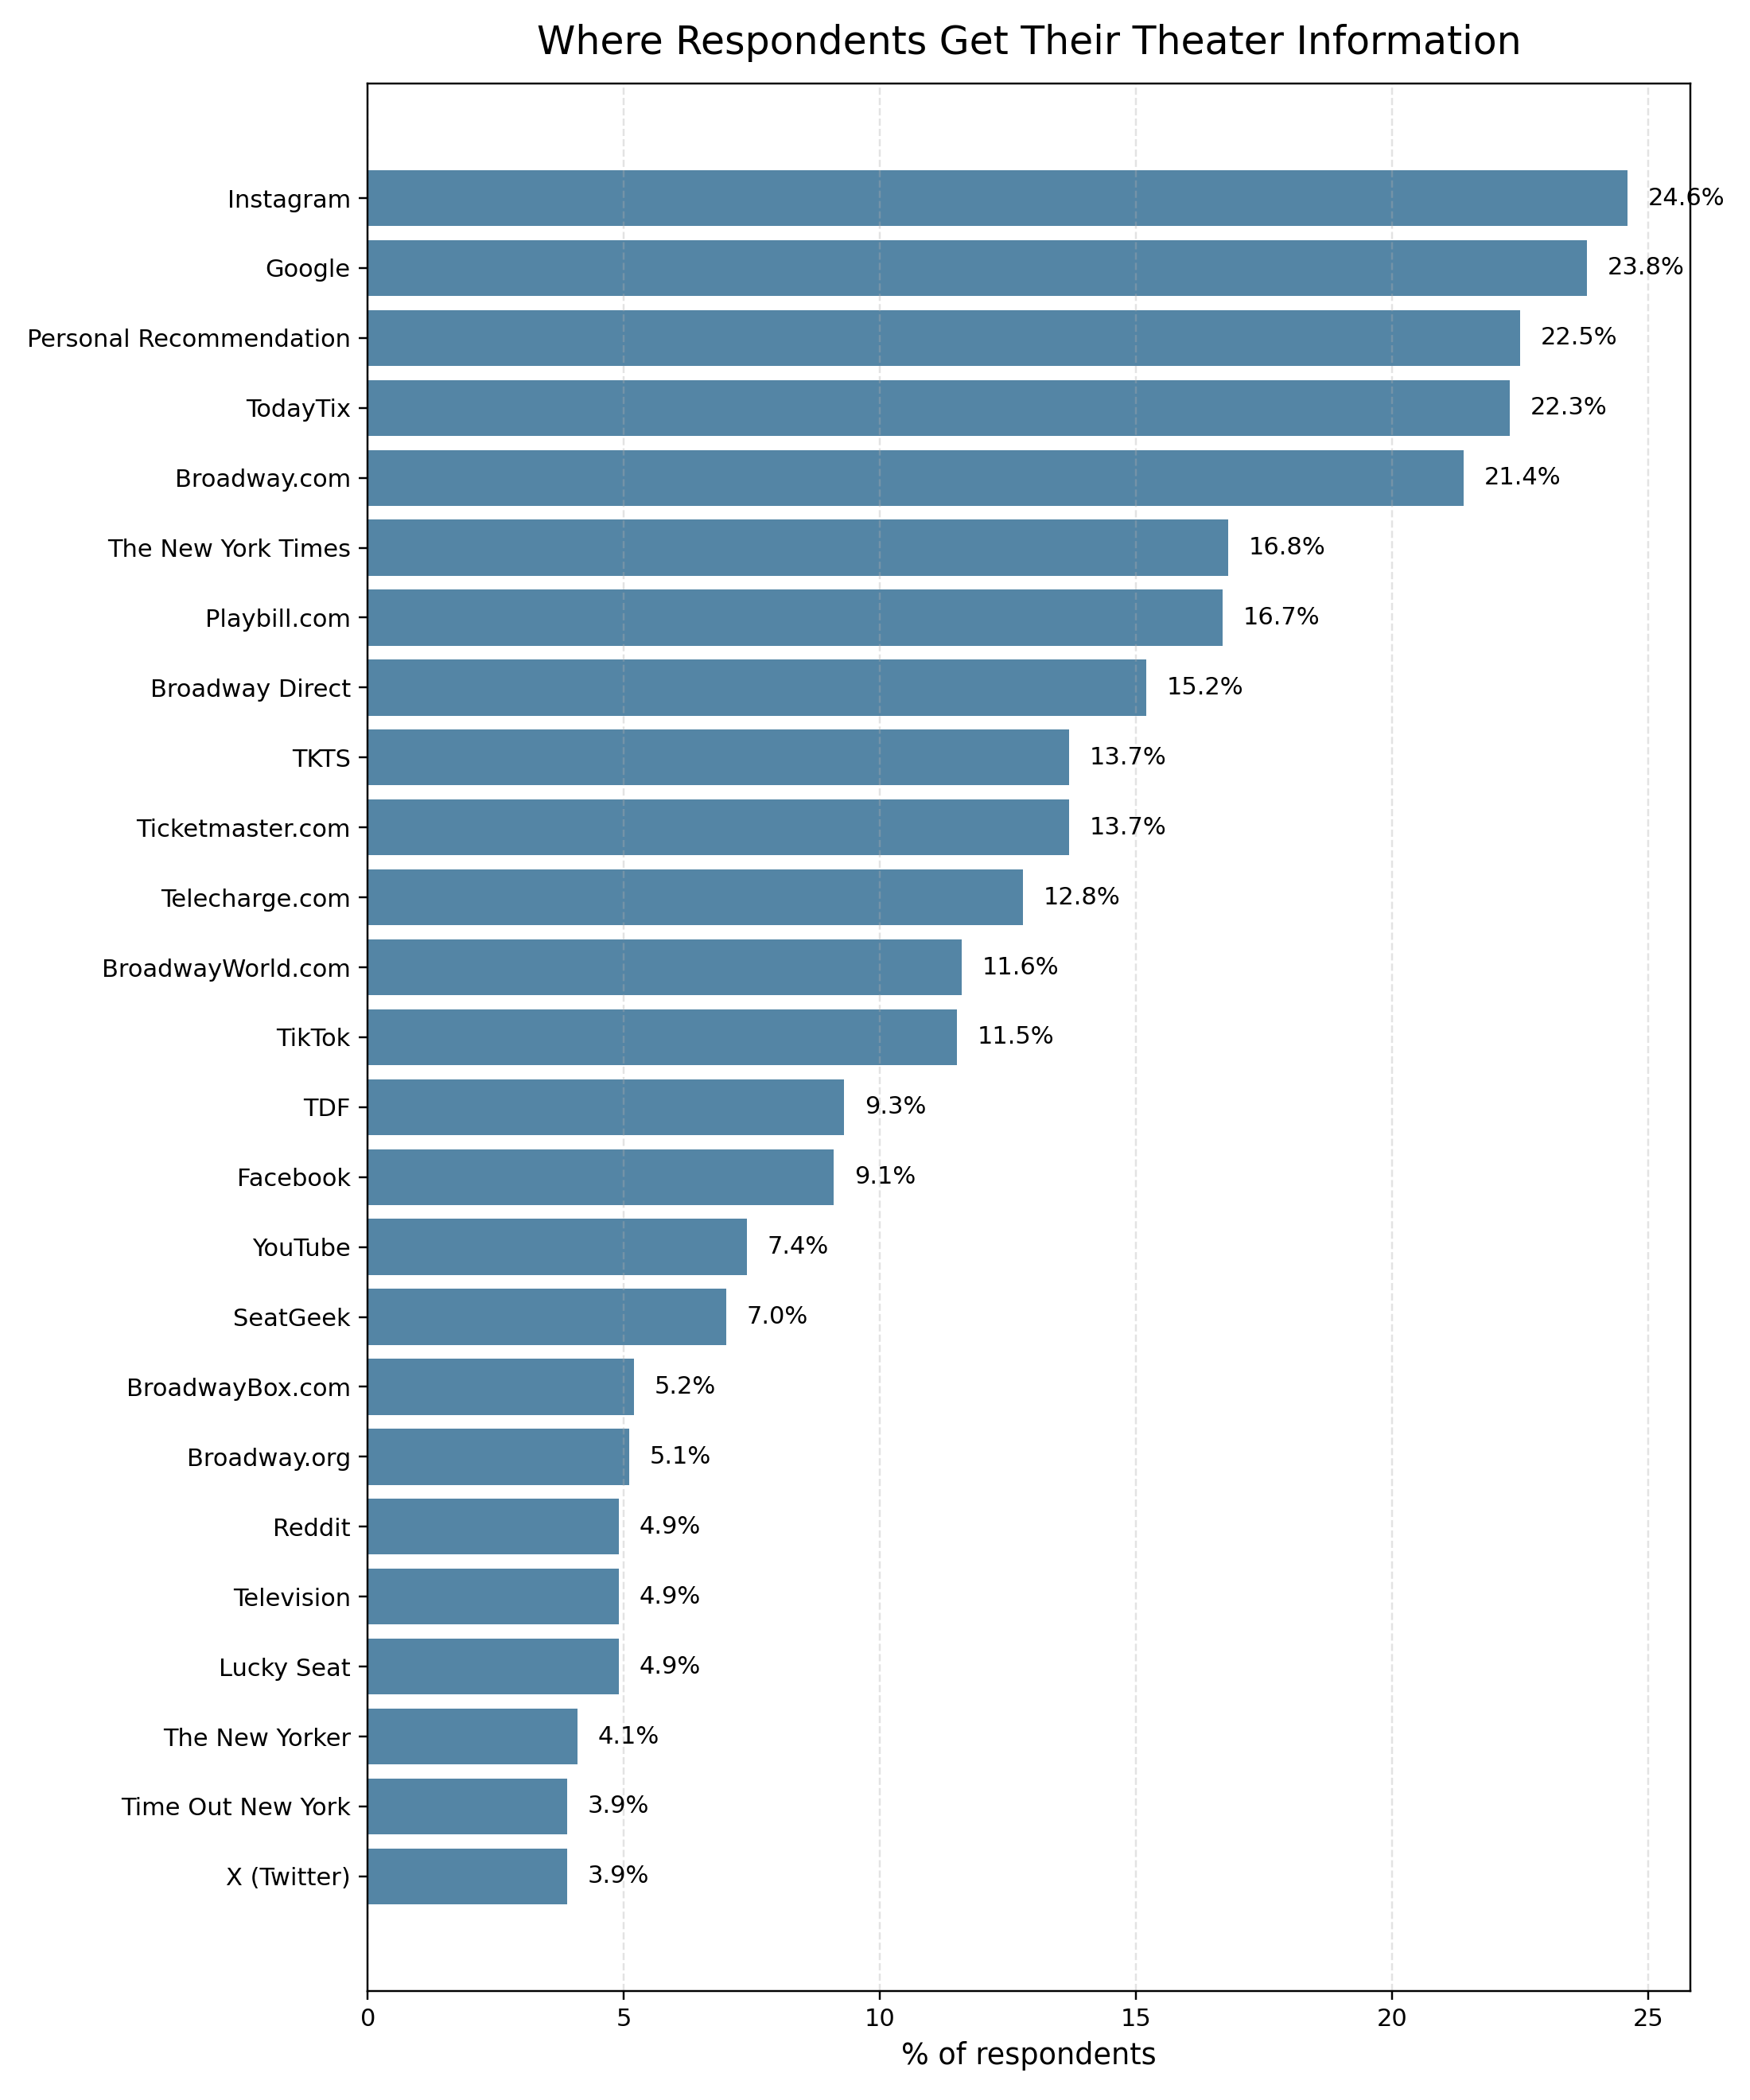
For the first time, Instagram is the #1 source of theatre information (24.6%), narrowly beating Google (23.8%) and personal recommendation (22.5%).
Motivators shifted: the strongest remain word-of-mouth (29.1%), source material/IP (23.4%), performers (22.7%), and music (22.0%). Tony Awards influence now sits at just 7.9% overall.
Play attendees were more likely motivated by performers (36.4%), critics (14.7%), and articles (17.0%) when compared to musicals — widening the marketing split between categories.
By segment: women reported using Instagram as a main theater news source more than men; NYC locals lean heavily on TodayTix and The New York Times; playgoers over-index on NYT/Telecharge relative to musical audiences.
Takeaways
INSTAGRAM. I’ve constantly emphasized that one of the biggest word-of-mouth generators these days is the ‘Playbill pic’ many take before a show. We’ve started to see producers catch onto this, with several productions quite literally putting the show name on their curtain or set. Other Instagrammable moments like a viral curtain call (looking at that one musical revival where the star was drenched in blood as she took a bow…) are easy wins for free publicity. Overall, this is the biggest word-of-mouth medium nowadays.
Budget reallocation: if you are over-funding awards positioning versus social storytelling and cast-related content, your spend is misaligned with how people are discovering shows today.
Data courtesy of the Broadway League.
3: Shorter Booking Curves, More Same-Day Buys
Highlights
The average purchase window shrank to 33 days, down from 47 days pre-COVID (2018-2019).
Same-day purchasing rose to 18.7% overall, with a striking 24.7% for international visitors. Domestic tourists plan further ahead (avg 38 days), NYC locals shortest (24 days).
Online purchasing dominates (37.2% purchased from web/app), but the box office purchases remain material. Notably, foreign online purchases jumped from 22% to 36% in just one season.
Takeaways
Run two funnels in parallel: A) a short-cycle tourist funnel (0-2 weeks) with geo-targeted Instagram/TikTok, hotel concierge outreach, TKTS, and “tonight/this weekend” copy with flash sale price points, and B) a medium-cycle domestic planner funnel (2-6 weeks) with retargeting, email nurtures, reviews content, and cast announcements timed to move buyers inside the 4-week decision band.
Domestic tourists pay the most (roughly $165.60), often via online channels with fees; locals pay less ($122.80) using TDF/rush/lottery. Use channel-specific messaging to land the right buyer at the right price point without eroding contribution magin.

Chart and data courtesy of The Broadway League.
4: Demographics Shifted: More Diverse, Still Highly Affluent, and Musicals Skew Younger
Highlights
BIPOC share reached 34% — a 30-year high, with Asian (11.6%) and Hispanic/Latine (9.4%) at record levels. NYC audiences are the most diverse of all residence segments.
Musicals attract more BIPOC audiences than plays.
Age profile is steady but bifurcated: average attendee is 41. Musicals 39.9 vs. plays 45.4. International audiences are younger (36.9) than domestic. Under-18 remains only 10.1%, despite increased childhood exposure programs.
Income and education remain exceptionally high: ~83% of 25+ attendees hold a college degree, 43% hold graduate degrees. The average household income for theater goers was around $276,465, with 29% at $250k+. Playgoers report higher incomes ($320k) than musical attendees ($267k).
Takeaways
Design premium experiences for affluent repeaters (VIP access, post-show talkbacks) alongside accessible entry points (rush/TDF, student nights) that widen the funnel for younger and more diverse segments.
Musical marketing can continue leaning into modern music languages, contemporary casting, and culturally resonant themes since these tend towards younger and more diverse audiences.
Programming plays with the local, older, affluent base in mind could be helpful — earlier curtains, targeted community partnerships, etc., can improve accessibility without sacrificing margin.

Chart and data courtesy of The Broadway League.
5: Plays’ Higher (Self-Reported) Ticket Price, Locals Pay Less, Tourists Absorb Fees
Highlights
Self-reported paid ticket average fell from $154.70 to $145.70, with plays averaging $164.40 vs. musicals $141.80. This is interesting, especially noting that plays historically have lower ATPs (this could potentially be attributed to several celebrity-driven plays emerging this previous season).
Locals pay least (NYC avg $122.80), with domestic tourists paying most (avg $165.60), often with online service fees. International audiences sit between ($137.00), increasingly online.
Takeaways
Construct distinct ladders for locals vs. tourists, using channel-specific incentives based on the audience.
Communicate value, not just price. If the average ticket price is $160+, every touch point must seem ‘worth it’ — from the online buying experience to the experience in the theater.
6: Transportation & Work Patterns Inform Scheduling
Highlights
66% travel on foot or by subway (NYC residents overwhelming subway; tourists walk).
22% of respondents work in NYC, most in-office 4-5 days/week; hybrid is real but ‘in-person’ days are concentrated, which can affect weekday demand curves.
Takeaways
Curtain times that match commute reality might be worthwhile. Slightly earlier weekday curtains might improve conversions among in-office crowds and suburban commuters.
Targeting office-dense zones with corporate offers for Tuesday-Thursday evenings can boost sales during intra-week slogs.
Chart and data courtesy of The Broadway League.
My Hot* Takes
*potentially just lukewarm
1) Awards are a weak lever. Social proof and IP run the show.
Only 7.9% of respondents cite the Tony Awards as a motivator while personal recommendations (29.1%), IP (23.4%), performers (22.7%), and music (22.0%) dominate. Pair that with Instagram being the #1 discovery channel, investing in the engine that makes people talk and share (clips, songs, stars) are most important — not just statues. If your budget over-weights awards season relative to social-native content, you’re misallocating spend. Awards may confirm taste for insiders, but don’t always create broad demand.
2) Suburban weekend matinee dependence is a structural risk.
The NYC suburbs’ 12.6% share is the lowest in three decades, and suburbanites prefer weekend matinees. Waiting for a rebound is magical thinking; the macro mix has shifted toward tourists (evenings) and locals. Suburban demand has become a bonus upside, not a base case. Either better programs need to be considered to increase suburban turnout or the current cost/price ladder needs to be restructured to survive a thinner suburban audience.
3) Shorter booking curves demand newsroom-style content cadences.
The average window for ticket purchasing is 33 days with same-day buys comprising 18.7% of all sales. Focus on compressed content sprints: cast announcements, critic pull-quotes, behind-the-scenes drops, and tonight/this week urgency. If your big social media moments land six weeks out, you’ll miss the prime booking window.
4) ‘Plays cost more’ is the wrong headline
Plays report $164.40 average paid (vs. $141.80 musicals), depending on a more older and affluent audience. This audience, though, is value-sensitive. If the experience doesn’t signal premium at every touchpoint, churn follows.
5) ‘Family Friendly’ isn’t a marketing line, it’s an operational mandate.
Under 18 attendance is 10.1% despite more childhood exposure to theatre. This tells us that friction could be operational (curtain times, length, group pricing) rather than awareness. If your show claims to be ‘family friendly’, prove it: look at earlier curtains, shorter runtimes, and weekday matinee experiments during school vacations. Otherwise, you’re selling to adults and calling it family.
6) Diversity gains are real - programming and marketing must catch-up.
BIPOC attendees make up 34% of all ticket-buyers. Cast and creative teams must reflect the audience you have, not the audience you remember. Build community partnership and language-aware creative; shift spend toward channels and neighborhoods that mirror these segments.
A Quick Note on Methodology
The report explains its methodology as follows:
“From June 2024 through May 2025, the League’s Research Department administered surveys at 52 different productions at 104 individual performance times. We selected performances on a quarterly basis to represent what Broadway was offering that season (a proportionate number of musicals versus plays; revivals versus original works; new productions versus long-running shows; weekday versus weekend; and evening versus matinee). In total, we distributed 20,007 paper questionnaires in person and 10,956 were returned, representing a 55% rate of return. Audiences were also able to complete the survey online via a QR code at these performances. Furthermore, audiences at other performances and shows could respond via a Wi-Fi link in the theatres. These electronic surveys added another 7,577 responses, bringing the total to 18,533. We tabulated the completed questionnaires and weighted the data based upon the actual paid attendance for each show.”
This report is a great resource for understanding current audiences on Broadway. But, as with any survey, rigor and transparency determine reliability. While random seat selection is a strength, several methodological gaps could affect interpretation:
Mode Effects and Calibration: The report confirms responses came from paper, QR, and Wi-Fi links, but doesn’t disclose any mode effect testing or mode-specific weighting. Digital channels likely over-represent younger, tech-savvy, and international patrons - skewing metrics like Instagram usage and online purchase rates.
Self-Reported Behavioral Data: Ticket price, purchase timing, and frequency are all self-reported, introducing recall bias. Without transaction-level validation, figures like ‘average ticket $145.70’ or ‘33-day purchase window’ should be treated as directional.
Currency & Income Reporting: The questionnaire asks for ‘annual household income (before taxes)’ with no guidance for international respondents - potentially inflating or distorting averages.
Uncertainty & Statistical Significance: The report publishes point estimates without confidence intervals, standard errors, or design effects, so year-over-year changes (e.g., foreign online purchases jumping from 22% to 36%) may not be statistically significant.
Wi-Fi Link Sampling Transparency: Allowing responses from ‘other performances’ via theatre Wi-Fi introduces uncontrolled self-selection. This report does not disclose how many responses came from these channels or whether deduplication was applied.
In Conclusion
Broadway audiences have certainly changed. However, shows that feel ‘effortlessly right’ aren’t lucky, but rather aligned with where demand lives now. If producing decisions don’t mirror those facts, the box office will remind us.
For every marketing decision in the coming year, I encourage producers to ask:
Which segment is this for? (NYC vs. suburbs vs. international)
Which motivator are we activating? (IP/music, performers, critics, word-of-mouth)
Which window will this win? (same-day, 2-4 weeks, or planners)